This post continues the series of posts on Cascade Models. From time to time I experiment with this type of models on graphs. Last month Misha Chertkov formulated the following question to me: “Is there a closed-form formula (or an efficient algorithm) that computes the most probable final state of a cascade model?”. Moreover: “What if we want to find K-th most probable final state?”; this question is related to rare event simulation.
I decided to start with some simulations on small graphs, and in this post, I will plot the full evolution and the graph of all possible outcomes of a cascade model with a few nodes. Given a graph and an initial infection, I will find all possible final states and, assuming that the probability to spread and infection is $p$ everywhere, I will plot the corresponding symbolic probability to finish in a given final state.
Preparations
import random
import networkx as nx
import matplotlib.pyplot as plt
import graphviz as gv
import os
from sympy import symbols, sympify
import itertools

cwd = os.getcwd()
The plotting function is as always; the freezing function is needed to work with model states as dictionary keys:
def plot(G, pos, S, I, R):
    plt.clf()
    plt.axis('off')
    nx.draw_networkx_nodes(G, pos, nodelist=S, node_size=200, node_color="blue")
    nx.draw_networkx_nodes(G, pos, nodelist=I, node_size=200, node_color="red")
    nx.draw_networkx_nodes(G, pos, nodelist=R, node_size=200, node_color="gray")
    nx.draw_networkx_edges(G, pos, width=0.4, alpha=0.5)
    nx.draw_networkx_labels(G, pos)
    plt.savefig(cwd+"/temp/{}{}{}.png".format(S,I,R))

def freeze(S,I,R):
    return (frozenset(S),frozenset(I),frozenset(R))
And let us generate a small graph:
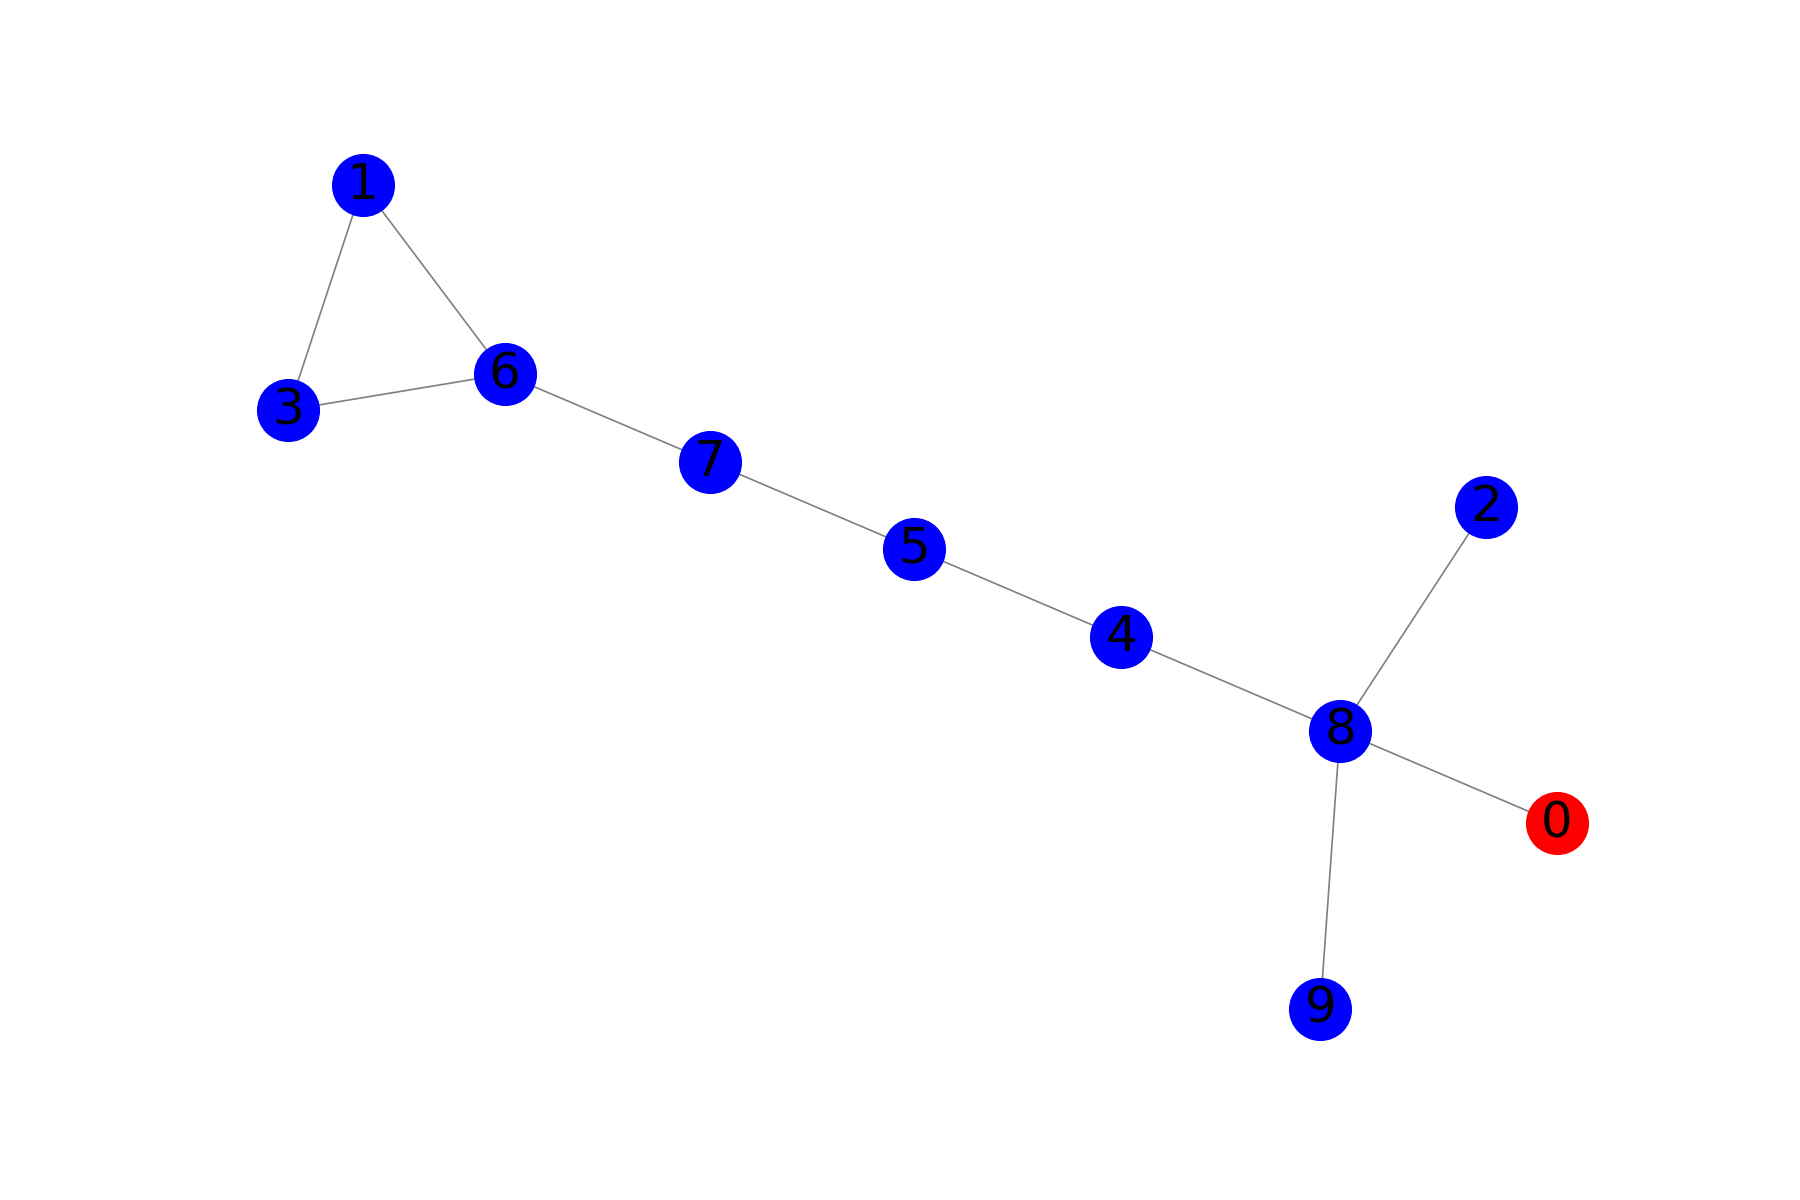
G = nx.generators.random_graphs.gnm_random_graph(10, 10, seed=1447)
nodes = set(G.nodes())
pos = nx.kamada_kawai_layout(G)
I = set([0])
S = nodes.difference(I)
R = set()
plot(G, pos, S, I, R)
What gives us
Symbolic probabilities
First, I create a graphviz graph. Nodes of this graph correspond to states of the Cascade Model, and edges correspond to transition events (samples of infection spreads from infected to susceptible nodes). Dictionary “leafs” will store these probabilities for ‘final’ states with no infected nodes.
g = gv.Digraph('G', filename='process.gv', engine='dot', strict=True)
gvshape = "box"
g.node("{}{}{}".format(S,I,R), label="",shape=gvshape, image=cwd+"/temp/{}{}{}.png".format(S,I,R))
leafs = {}
Next, I brute force all possible events. One can think of infection-spreading events as a sequence of coin tosses: at every time step, every infected node tosses a coin for each susceptible neighbor (tossing heads means that the neighbor becomes infected). For this graph, it is possible to upper-bound the maximal number of coin tosses by 15, for example.
allTosses = list(itertools.product([0, 1], repeat=15))
coveredTosses = []
random.seed(a = 0)


while len(allTosses) != 0:
    tossSeq = allTosses.pop(0)
    tossStep = 0

    I = set([0])
    S = nodes.difference(I)
    R = set()
    p = symbols('p')
    expr = 1

    while len(I) != 0:
        new_R = R.union(I)
        new_S = set(S)
        new_I = set()
        for node in I:
                for child in G.neighbors(node):
                    if child in new_S:
                        toss_a_coin = tossSeq[tossStep]
                        tossStep += 1

                        if toss_a_coin == 1:
                            expr = expr*p
                            new_I.add(child)
                            new_S.remove(child)
                        else:
                            expr = expr*(1-p)


        triple2 = freeze(new_S,new_I,new_R)

        if len(new_I) == 0:
            if triple2 not in leafs.keys():
                leafs[triple2] = [expr]
            else:#if expr not in leafs[triple2]:
                leafs[triple2].append(expr)

        S,I,R = new_S,new_I,new_R

    coveredTosses.append(tossSeq[:tossStep])
    allTosses = [t for t in allTosses if t[:tossStep] != coveredTosses[-1]]
Building a graph of all states
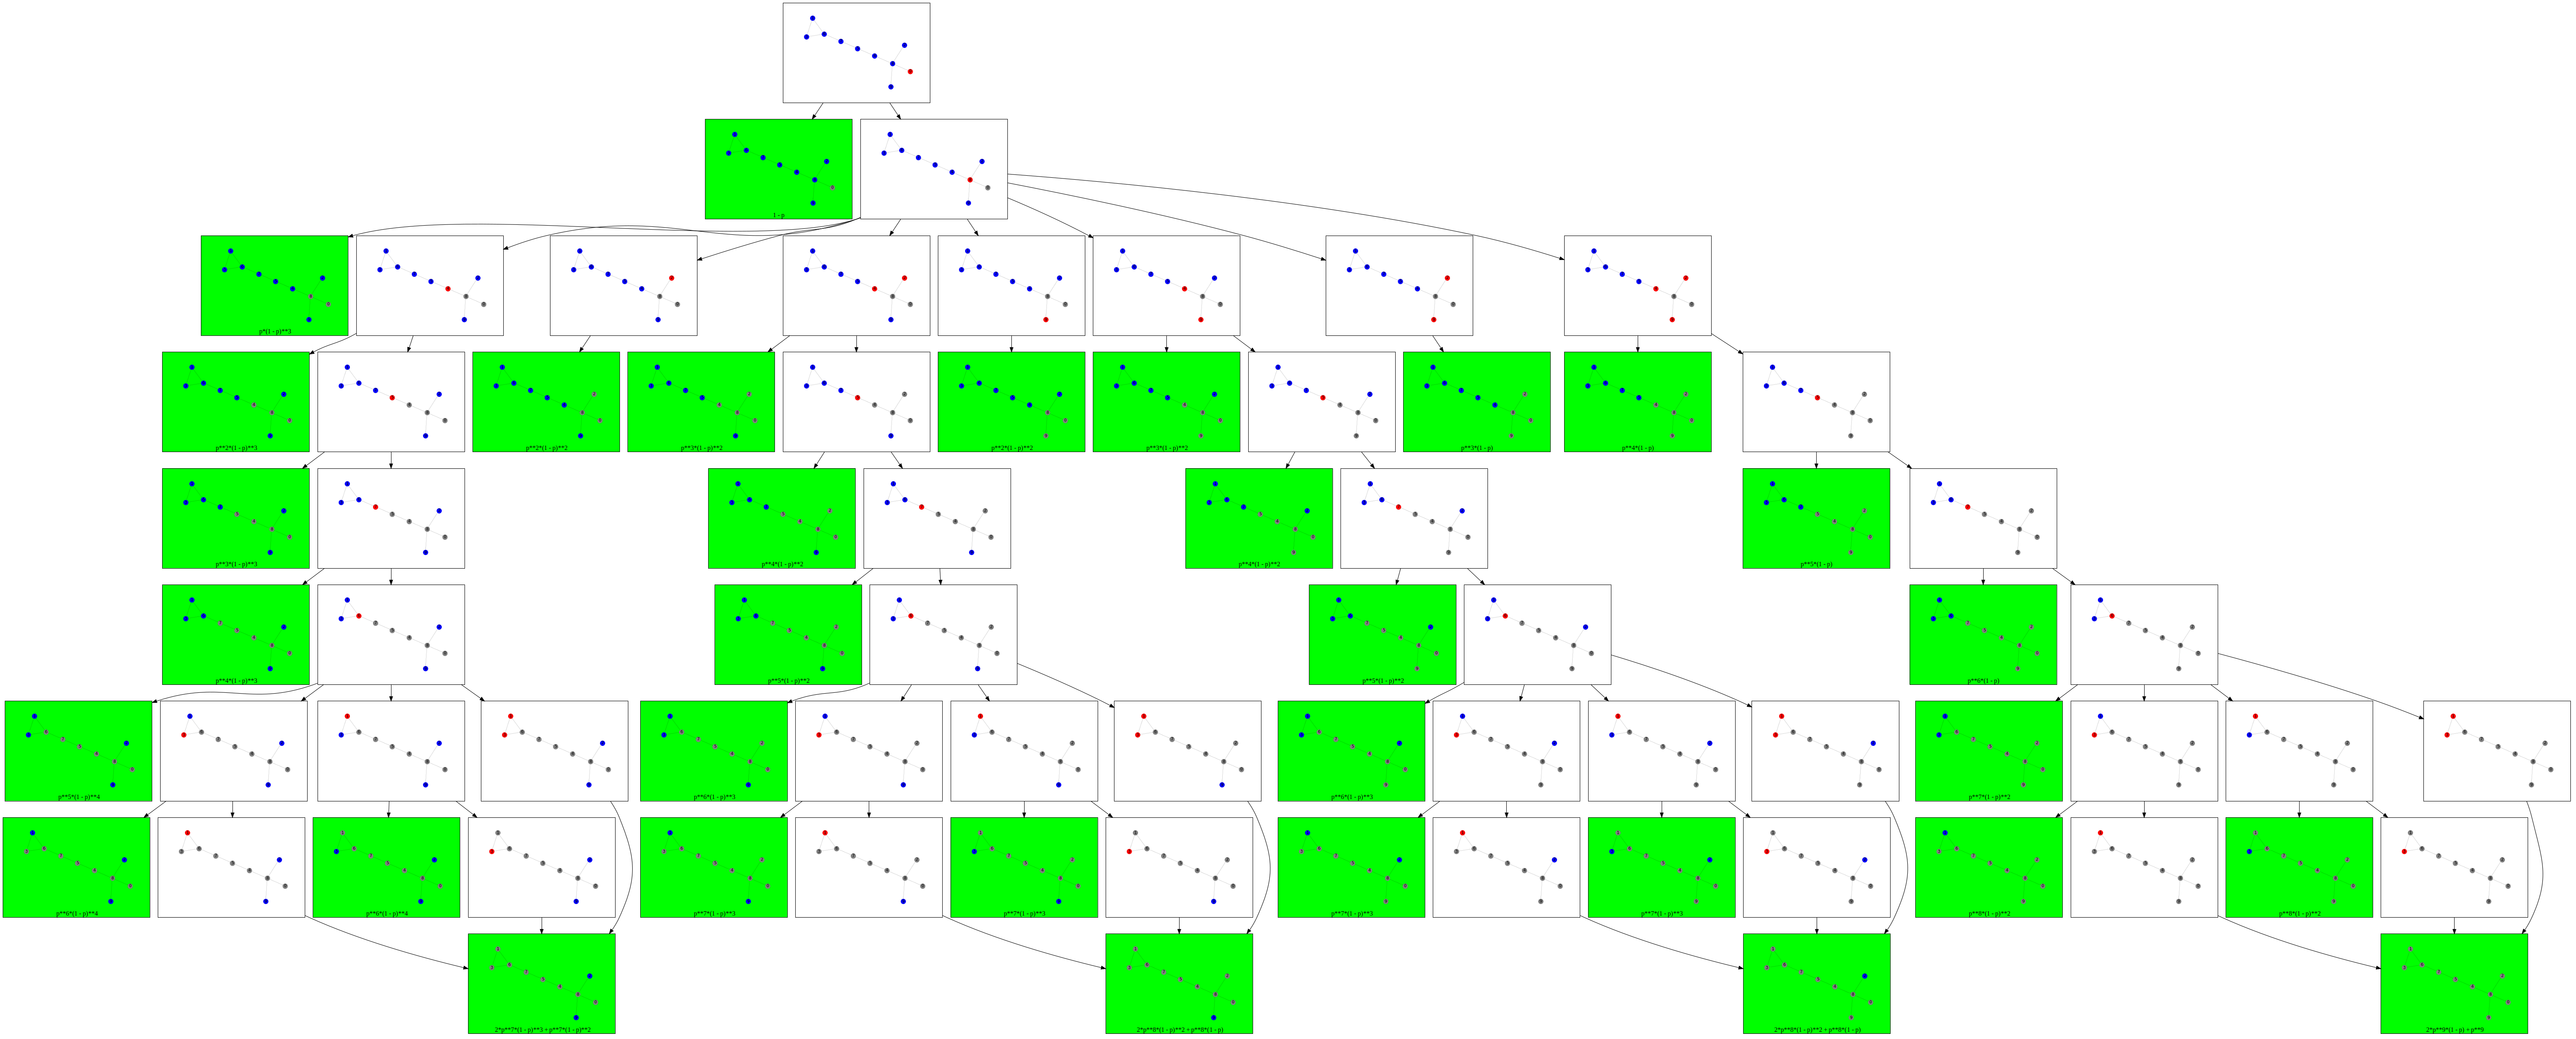
Finally, we repeat almost the same procedure and generate a graphviz graph:
for tossSeq in coveredTosses:
    tossStep = 0

    I = set([0])
    S = nodes.difference(I)
    R = set()

    while len(I) != 0:
        new_R = R.union(I)
        new_S = set(S)
        new_I = set()
        for node in I:
                for child in G.neighbors(node):
                    if child in new_S:
                        toss_a_coin = tossSeq[tossStep]
                        tossStep += 1
                        if toss_a_coin == 1:
                            new_I.add(child)
                            new_S.remove(child)

        new_node_param = {"label":"", "labelloc":"b",
                          "shape":gvshape, "image":cwd+"/temp/{}{}{}.png".format(new_S,new_I,new_R)}


        triple2 = freeze(new_S,new_I,new_R)
        if len(new_I) == 0:
            new_node_param['fillcolor'] = "green"
            new_node_param['style'] = "filled"
            new_node_param['label'] = "{}".format(sum(leafs[triple2]))


        plot(G,pos,new_S,new_I,new_R)
        g.node("{}{}{}".format(new_S,new_I,new_R), **new_node_param)
        g.edge("{}{}{}".format(S,I,R), "{}{}{}".format(new_S,new_I,new_R), label="")

        S,I,R = new_S,new_I,new_R
What gives us an illustration like this:
Sanity check
Finally, we may want to check that all final states are covered by our brute force algorithm. So we evaluate symbolic probabilities at any point $p$:
all_leaf_exprs = [sum(expr) for leaf, expr in leafs.items()]
total = sum(all_leaf_exprs)
total.evalf(subs={p:0.7})