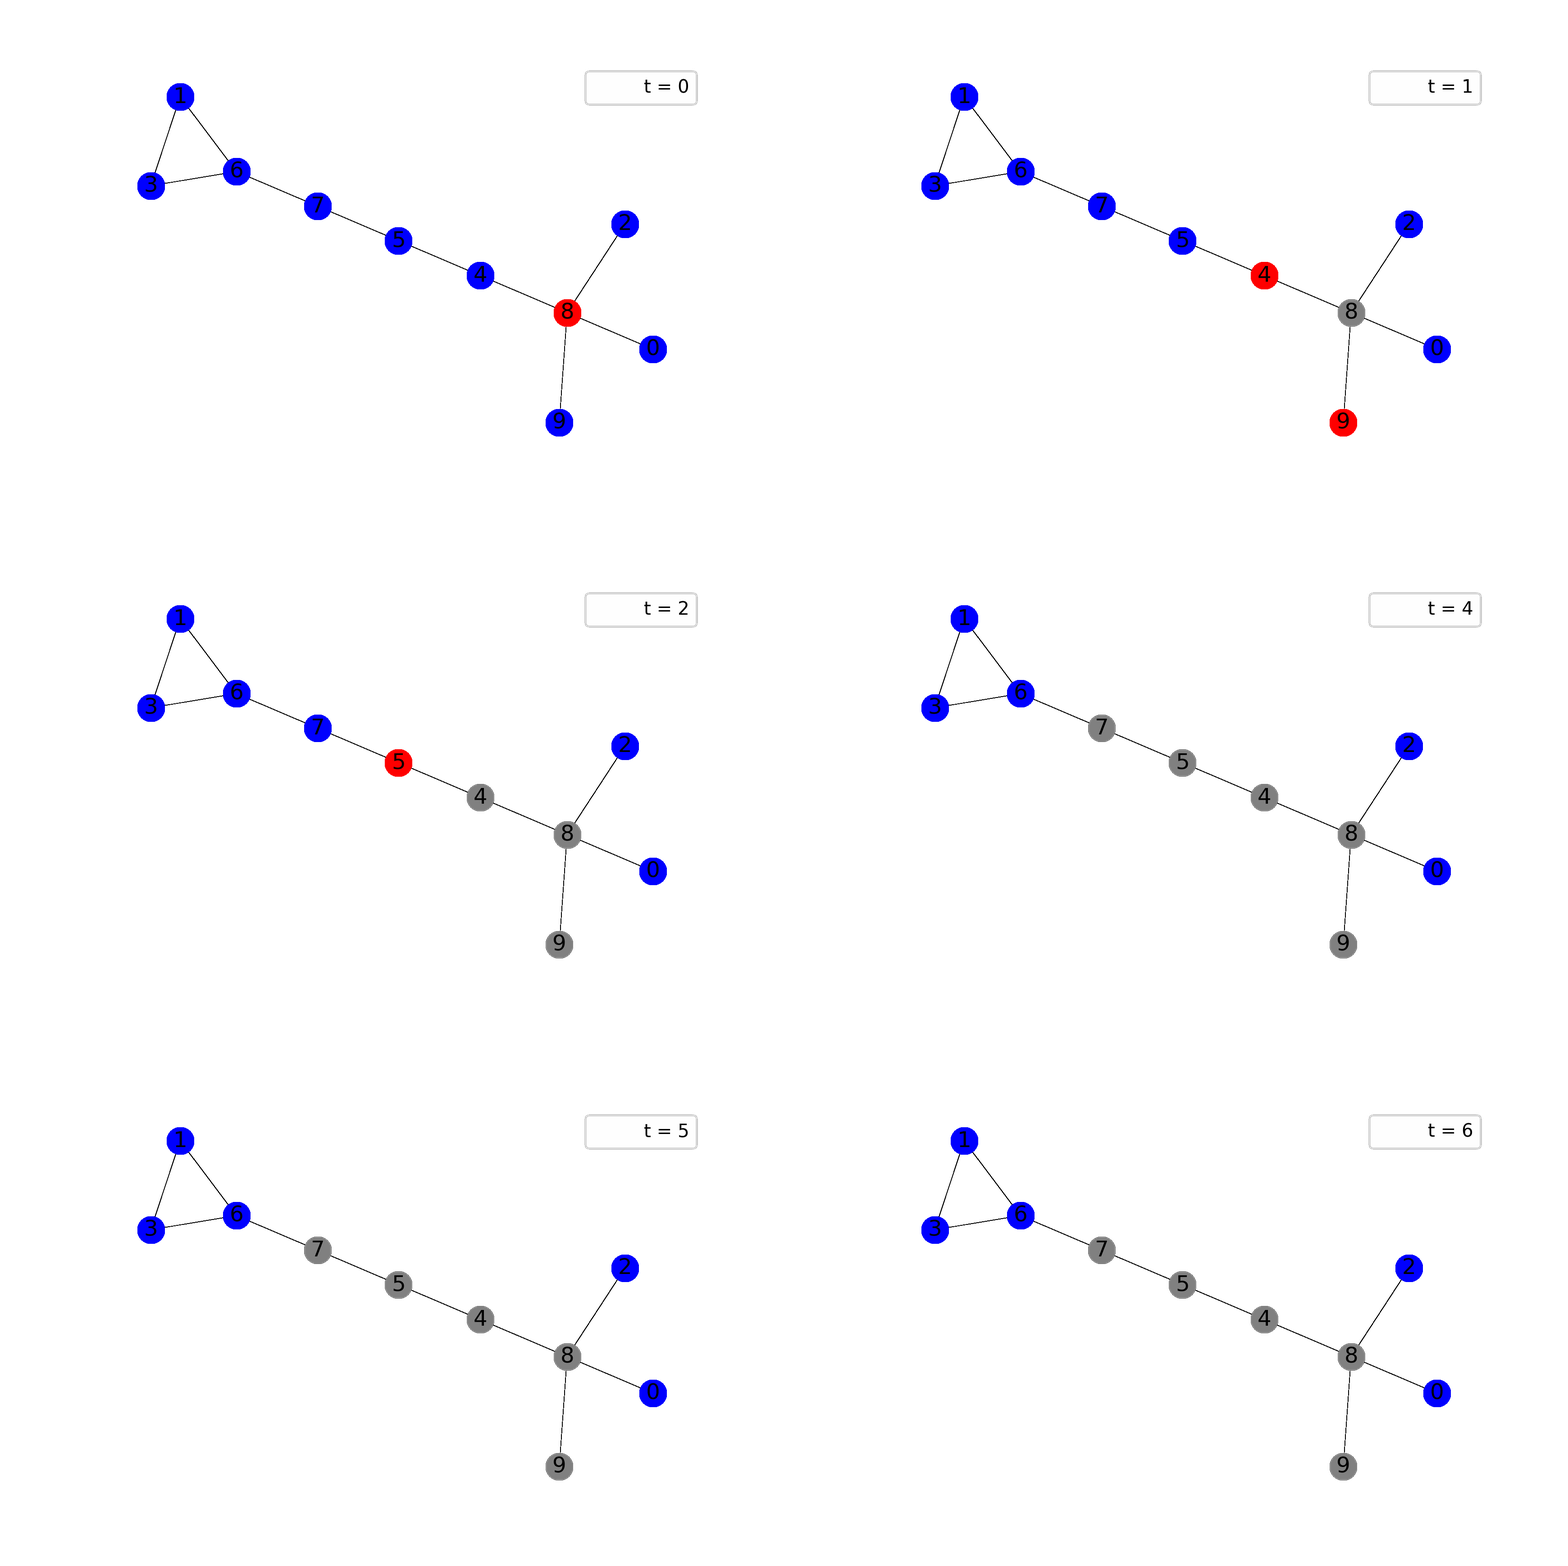
A year ago I worked with researchers from the University of Arizona under the supervision of Misha Chertkov. We were working on pandemy modeling and have finally published a paper in Scientific Reports. In my first blog post, I will describe a simple but fruitful Cascade model and will show one possible way to visualize this model’s dynamics in Python. Remember, all models are wrong, but some are useful .
Cascade model
Cascade models arise in network science and are successfully used to simulate failures in social, peer-to-peer, and other kinds of networks, see our preprint on medrxiv and references therein for more information. In this post, I will describe a naive version of the Cascade model, but keep in mind that the model may be easily generalized to weighted, directed graphs, non-uniform transition probabilities, and whatever your needs are.
(Independent) Cascade Model is a discrete-time dynamical system on a simple undirected graph $G = (V, E)$. Vertices of a graph can be in either of three following states: Susceptible, Infected and Removed (also called SIR model). Initially, at time $t=0$, some vertices $v\in I_0 \subseteq V$ are Infected and all other vertices $v\in S_0 = V\setminus I_0$ are Susceptible. For simplicity, let’s assume that infection probability $p$ is constant. Then, the system evolves following the rules below:
- If a node $a\in I_t \subseteq V$ is infected at the step $t$, it infects its child, $b\in V$, at the next step $t + 1$, with the probability $p$.
- Each child (of a parent) is infected independently.
- Each node infects its children independently of other nodes.
- Infected node $v\in I_t$ stays Infected only for one step and then becomes Removed $v\in R_{t+1}$ and can never be infected again.
Animating a model
The best way to feel the model is through visualization, I believe. The following gif shows ane possible sample of the system’s dynamics. Here, we plot susceptible vertices in blue color, infected vertices in red, and removed vertices in gray. Initially, only node 8 is infected; the probability to infect a child equals $0.5$ in this case:

To get animations like this we need only NetworkX and Matplotlib:
import random
import networkx as nx
import matplotlib.pyplot as plt
import matplotlib.animation as animation
At every time step we use the following function to plot the state of the system:
def ax_pattern(G, pos, susceptible, infected, removed, t, ax):
    ax.clear()
    ax.axis('off')
    nx.draw_networkx_nodes(G, pos, nodelist=susceptible, node_size=200, node_color="blue", ax=ax)
    nx.draw_networkx_nodes(G, pos, nodelist=infected, node_size=200, node_color="red", ax=ax)
    nx.draw_networkx_nodes(G, pos, nodelist=removed, node_size=200, node_color="gray", ax=ax)
    nx.draw_networkx_edges(G, pos, width=0.2, ax=ax)
    nx.draw_networkx_labels(G, pos)
    ax.plot([], [], ' ', label="t = {}".format(t))
    ax.legend()
The next function implements a single time step of a cascade model:
def cascade_step(G, p, susceptible, infected, removed):
    new_removed = removed.union(infected)
    new_susceptible = susceptible
    new_infected = set()

    for node in infected:
        for child in G.neighbors(node):
            if child in new_susceptible:
                toss_a_coin = random.random()
                if toss_a_coin < p:
                    new_infected.add(child)
                    new_susceptible.remove(child)

    return new_susceptible, new_infected, new_removed
Finally, the function that implements animation looks as follows:
def sir_gif(G, infected, p=0.7, max_iter=100, seed=1):
    random.seed(a = seed)
    pos = nx.kamada_kawai_layout(G)
    nodes = set(G.nodes())
    susceptible = nodes.difference(infected)
    removed = set()

    fig, ax = plt.subplots()

    def animate(i, lst, ax):
        G = lst[0]
        pos = lst[1]
        susceptible = lst[2]
        infected = lst[3]
        removed = lst[4]

        if (i == 0) or (len(infected) == 0):
            ax_pattern(G, pos, lst[2], lst[3], lst[4], i, ax)
        else:
            lst[2], lst[3], lst[4] = cascade_step(G, p, susceptible, infected, removed)
            ax_pattern(G, pos, lst[2], lst[3], lst[4], i, ax)


    life_animation = animation.FuncAnimation(fig, animate,
                                             fargs=([G, pos, susceptible, infected, removed], ax),
                                             save_count=max_iter, interval = 1000, repeat = False)

    life_animation.save('SIR.gif', writer='imagemagick', fps=1, dpi=300)
The corresponding jupyter notebook is here.