My other hobby is learning about blockchain technology, and I like to learn by experiment. In this post, I will use API by Blockchain.com to get raw block data in JSON format. This API has a request limit of a maximum of 1 request every 10 seconds. A more efficient way would be running a bitcoin node; however, this is not always a convenient way.
Loading block
We will need just the following 5 imports:
import os
import requests
import time
import graphviz as gv
import networkx as nx
I prefer graphviz tool for this task, as far as it tackles multiple parallel edges more easily. The function below requests block information by its hash:
def get_block(blockhash):
    link = "https://blockchain.info/rawblock/" + blockhash
    r = requests.get(url = link)
    time.sleep(10) # API requests limit is 10 seconds
    if r is not None:
        return r.json()
For example, for a recent block with height 747340, mined on 2022-07-31 13:27, it gives the json below (check the documentation):
{
'hash': '000000000000000000098b75f243ab22a063df5cbca0bd44d9d4be026eed31dd',
'ver': 536870912,
'prev_block': '00000000000000000009d91aecf64f4afdf3943af532e70c41f80ada1b0bf5e1',
'mrkl_root': '747b9fb6879afeddd38cc33bf2b5367304fc42b64d15be5dddcc6f140603e15e',
'time': 1659263221,
'bits': 386542084,
'next_block': ['0000000000000000000035245138c40ca12f428c570e0bb1020569d68a1c0d59'],
'fee': 5604782,
'nonce': 2936189164,
'n_tx': 1463,
'size': 814671,
'block_index': 747340,
'main_chain': True,
'height': 747340,
'weight': 2194149,
'tx': [...]
}
Constructing graph of transactions
We construct a Digraph object from graphviz. First, we extract the list of all transactions (each transaction is a JSON file itself) and then add transaction to the block graph.
def block_gv(block):
    txs = block["tx"]
    g = gv.Digraph()
    for tx in txs:
        add_tx_gv(g, tx)

    return g
Each transaction can be considered as double-entry bookkeeping, which is nicely described in Mastering Bitcoin. Thus, the graph of transactions can be considered as a bipartite directed graph with wallet (address) nodes in one part and transaction nodes in the other. I visualize transactions as follows, red nodes are transactions and green nodes are wallets:
def add_tx_gv(g, tx, with_labels=False, scale=str(0.2)):
    if with_labels:
        g.node(tx['hash'], fillcolor="red", style="filled", shape="diamond", width=scale, height=scale)
    else:
        g.node(tx['hash'], label="", fillcolor="red", style="filled", shape="diamond", width=scale, height=scale)

    for input_ in tx['inputs']:
        if 'addr' in input_['prev_out'].keys():
            if with_labels:
                g.node(input_['prev_out']['addr'], fillcolor="green", style="filled", width=scale, height=scale)
            else:
                g.node(input_['prev_out']['addr'], label="", fillcolor="green", style="filled", width=scale, height=scale)
            g.edge(input_['prev_out']['addr'], tx['hash'])

    for output_ in tx['out']:
        if 'addr' in output_.keys():
            if with_labels:
                g.node(output_['addr'], fillcolor="green", style="filled", width=scale, height=scale)
            else:
                g.node(output_['addr'], label="", fillcolor="green", style="filled", width=scale, height=scale)
            g.edge(tx['hash'], output_['addr'])
For example, a single transaction number thirteen in block 747340 looks like this:
Results
Finally, I render the result using dot and convert to .png:
def dot_render(g, filename="graph"):
    g.save("temp.dot")
    path = os.getcwd()
    os.system("dot -Kfdp -Tpng {}/temp.dot -o {}/{}.png".format(path, path, filename))
    os.system("rm {}/temp.dot".format(path))
For blocks 747340, 747341 and 747342 I got ‘bacteria’-like pictures below:
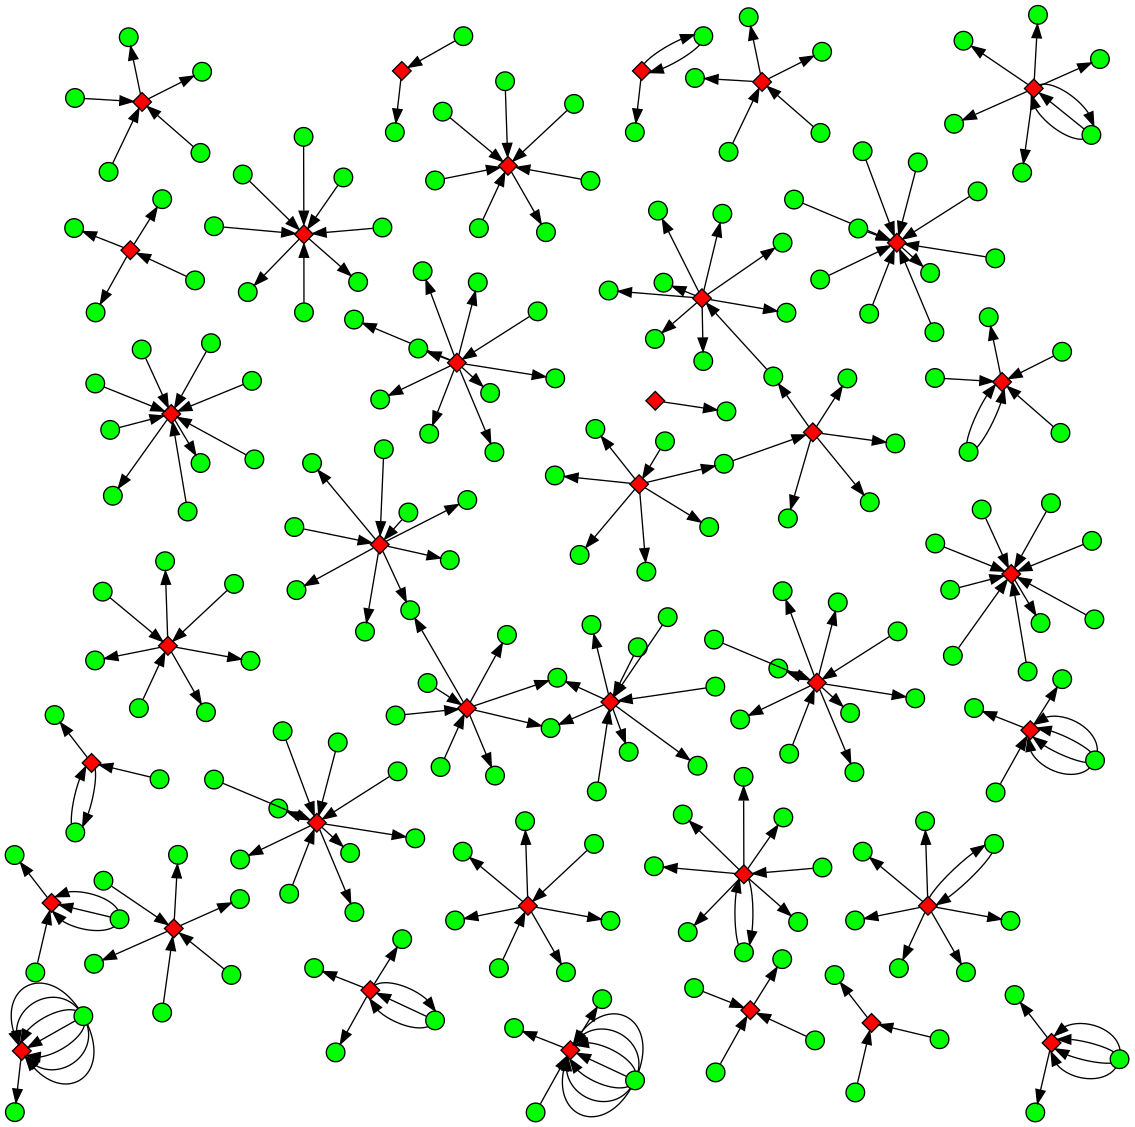
Transaction zoo
Transactions can have different numbers of inputs and outputs; here we plot transactions of block 747340 without transaction topology duplication. We call (input_size, output_size)-pair (topological) pattern of a transaction. If the pattern was already observed we do not plot the corresponding transaction. For illustration purposes, we consider only transactions with a small total number of input and outputs.
unique_txs = {}
for tx in txs:
    pattern = (tx['vin_sz'], tx['vout_sz'])
    if pattern not in unique_txs.keys():
        if pattern[0] + pattern[1] <= 10:
            unique_txs[pattern] = tx
Transaction zoo of block 747340 then looks as follows:
Rendering with SVG and URL
Rendering function can be also updated to support filetypes other than “.png”:
def dot_render(g, fname="graph", ftype="png"):
    g.save("temp.dot")
    path = os.getcwd()
    os.system("dot -Kfdp -T{} {}/temp.dot -o {}/{}.{}".format(ftype, path, path, fname, ftype))
    os.system("rm {}/temp.dot".format(path))
Now we consider “.svg” filetype. This type can now contain hyperlinks when opened in browser. The code below not only adds transaction to a graph but also add the corresponding hyperlinks to blockchain explorer:
def add_tx_gv(g, tx, with_labels=True, scale=str(0.2)):
    tx_url = "https://www.blockchain.com/btc/tx/"+tx['hash']
    if with_labels:
        g.node(tx['hash'], fillcolor="red", style="filled", shape="diamond", width=scale, height=scale, href=tx_url)
    else:
        g.node(tx['hash'], label="", fillcolor="red", style="filled", shape="diamond", width=scale, height=scale, href=tx_url)

    for input_ in tx['inputs']:
        if 'addr' in input_['prev_out'].keys():
            addr_url = "https://www.blockchain.com/btc/address/" + input_['prev_out']['addr']
            if with_labels:
                g.node(input_['prev_out']['addr'], fillcolor="green", style="filled", width=scale, height=scale, href=addr_url)
            else:
                g.node(input_['prev_out']['addr'], label="", fillcolor="green", style="filled", width=scale, height=scale, href=addr_url)
            g.edge(input_['prev_out']['addr'], tx['hash'])

    for output_ in tx['out']:
        if 'addr' in output_.keys():
            addr_url = "https://www.blockchain.com/btc/address/" + output_['addr']
            if with_labels:
                g.node(output_['addr'], fillcolor="green", style="filled", width=scale, height=scale, href=addr_url)
            else:
                g.node(output_['addr'], label="", fillcolor="green", style="filled", width=scale, height=scale, href=addr_url)
            g.edge(tx['hash'], output_['addr'])
The result is shown below. Now user can click transaction hash or wallet address and proceed with blockchain explorer: